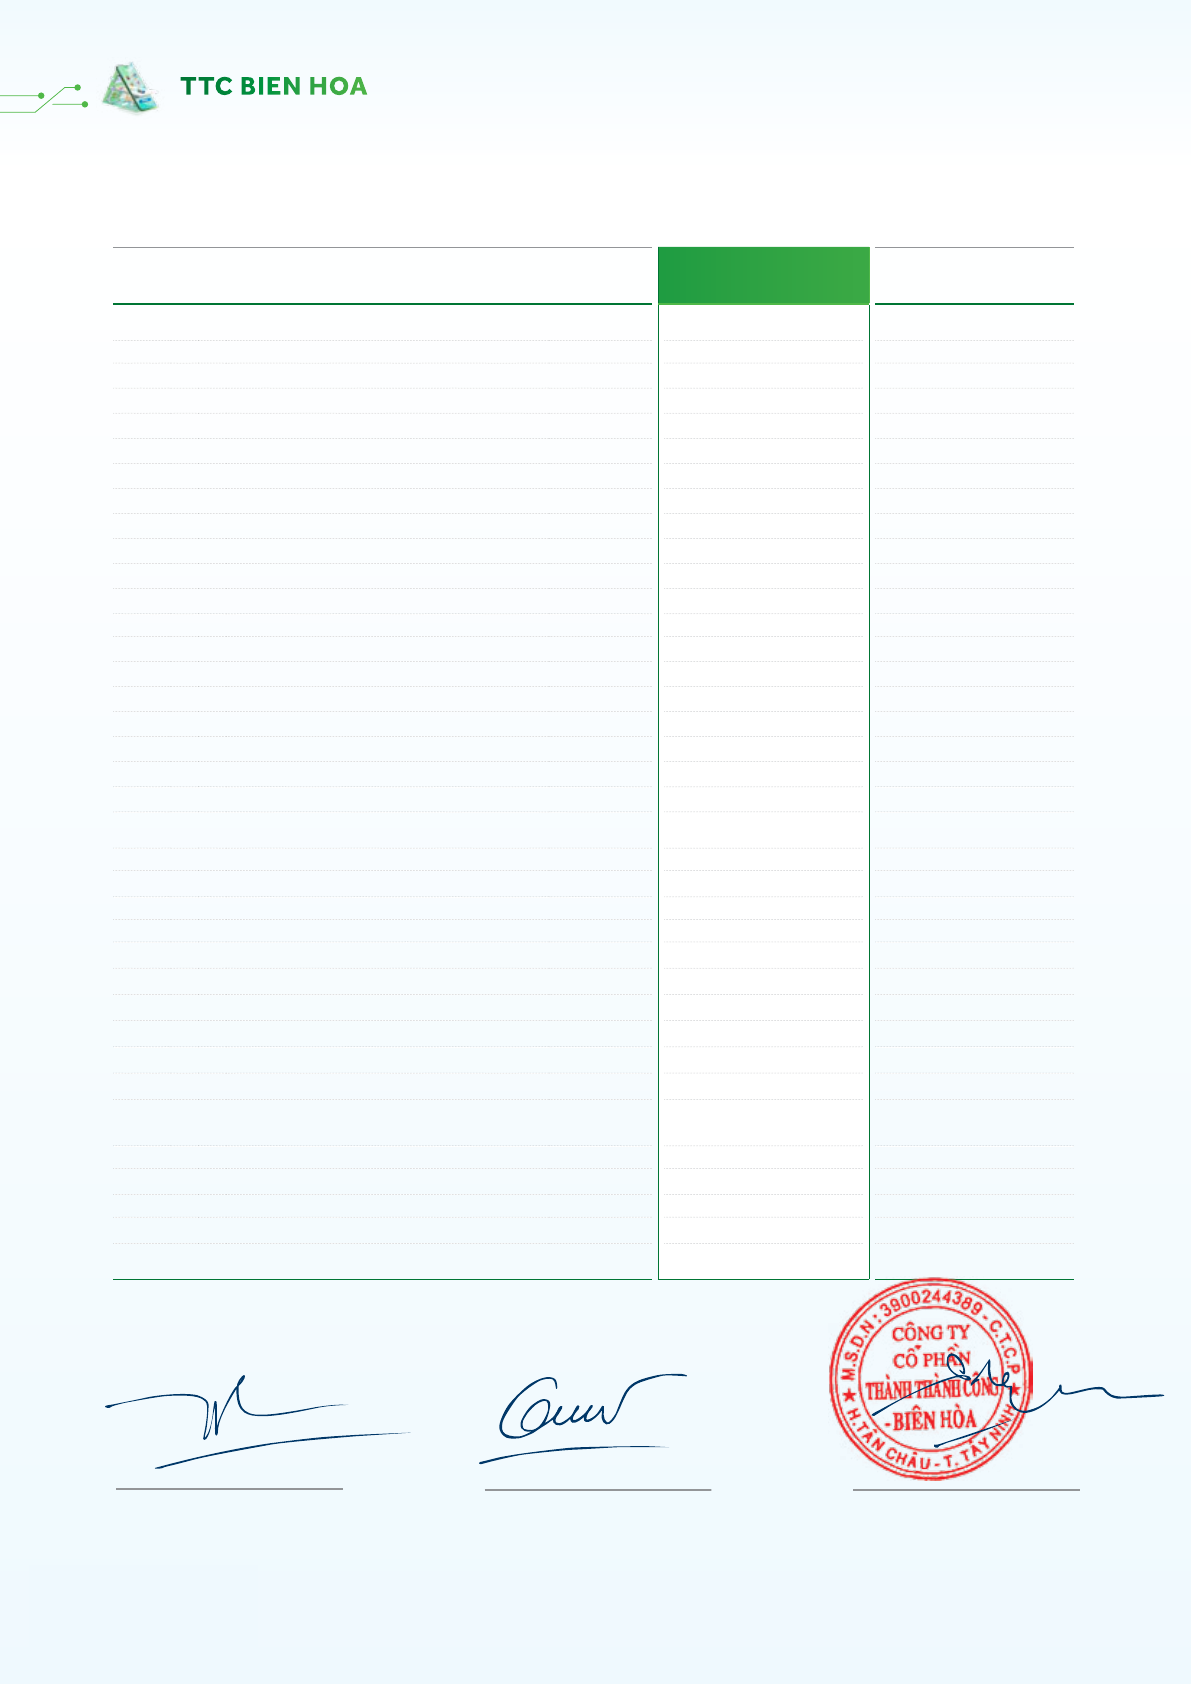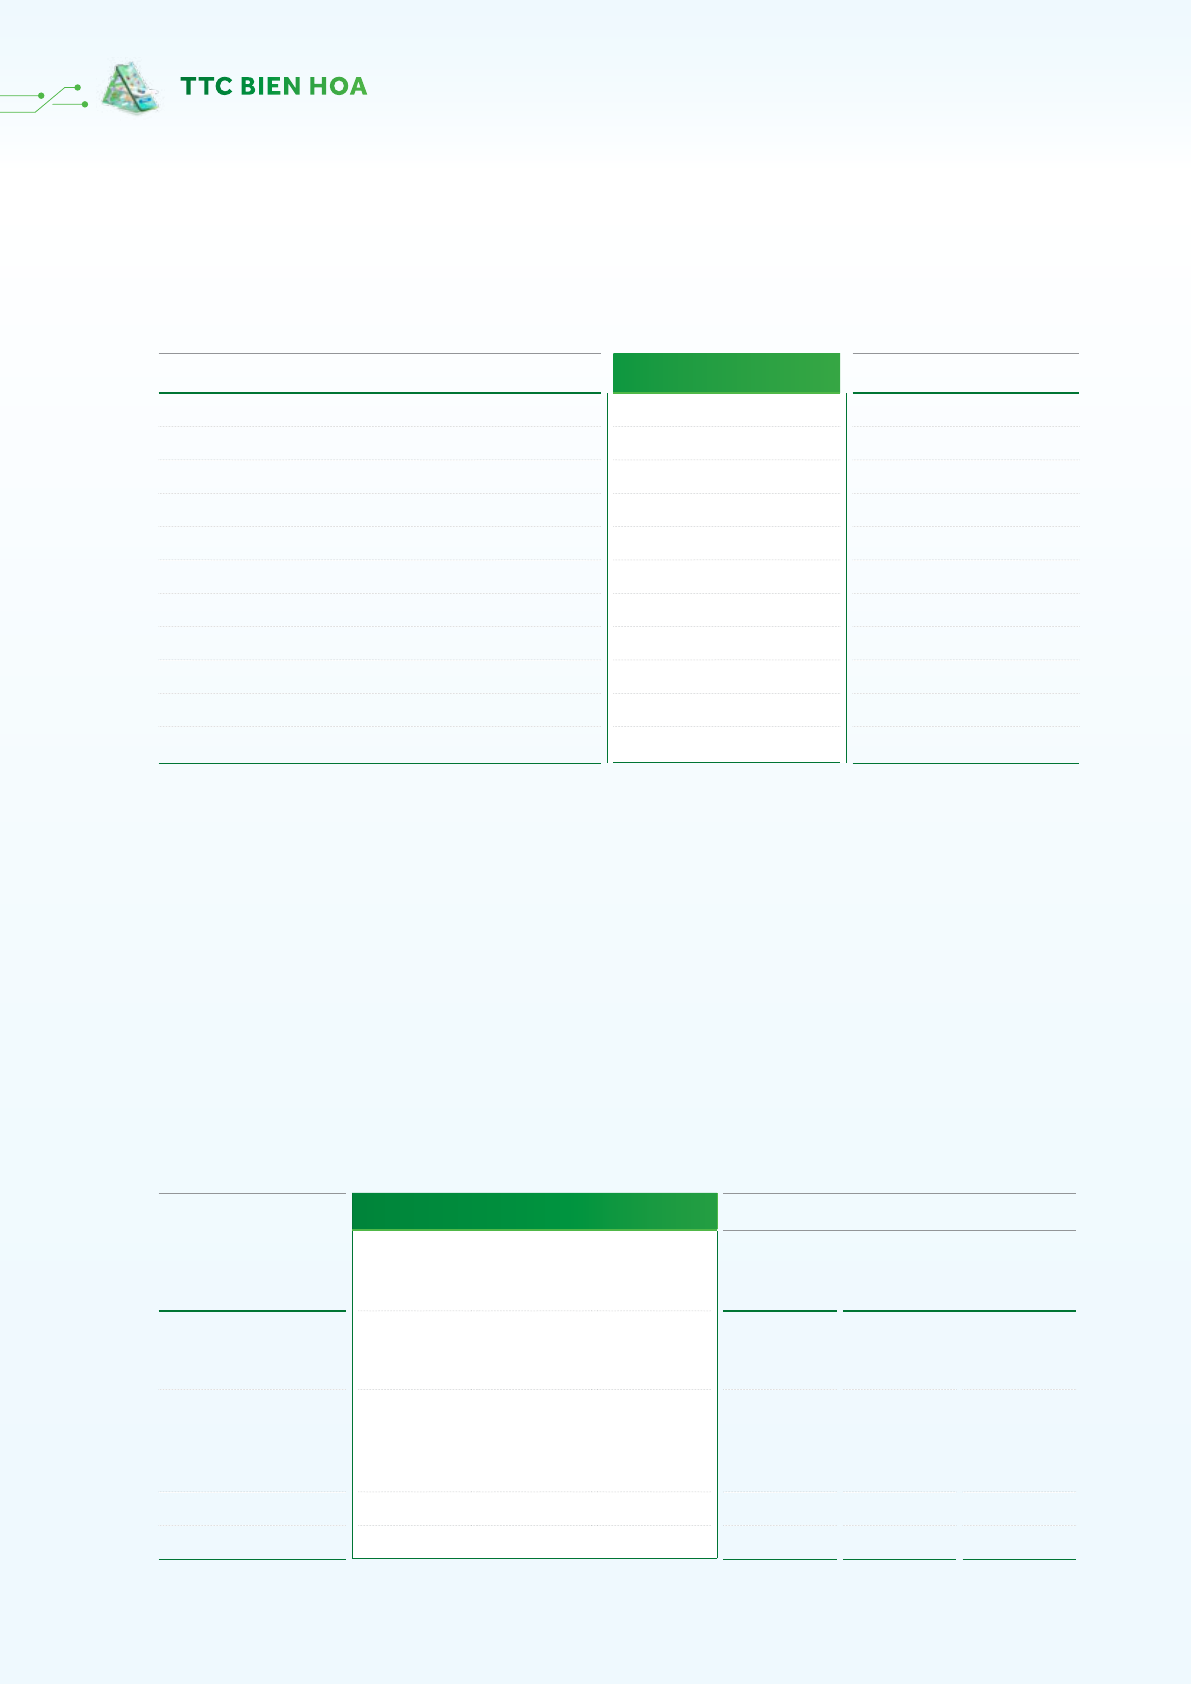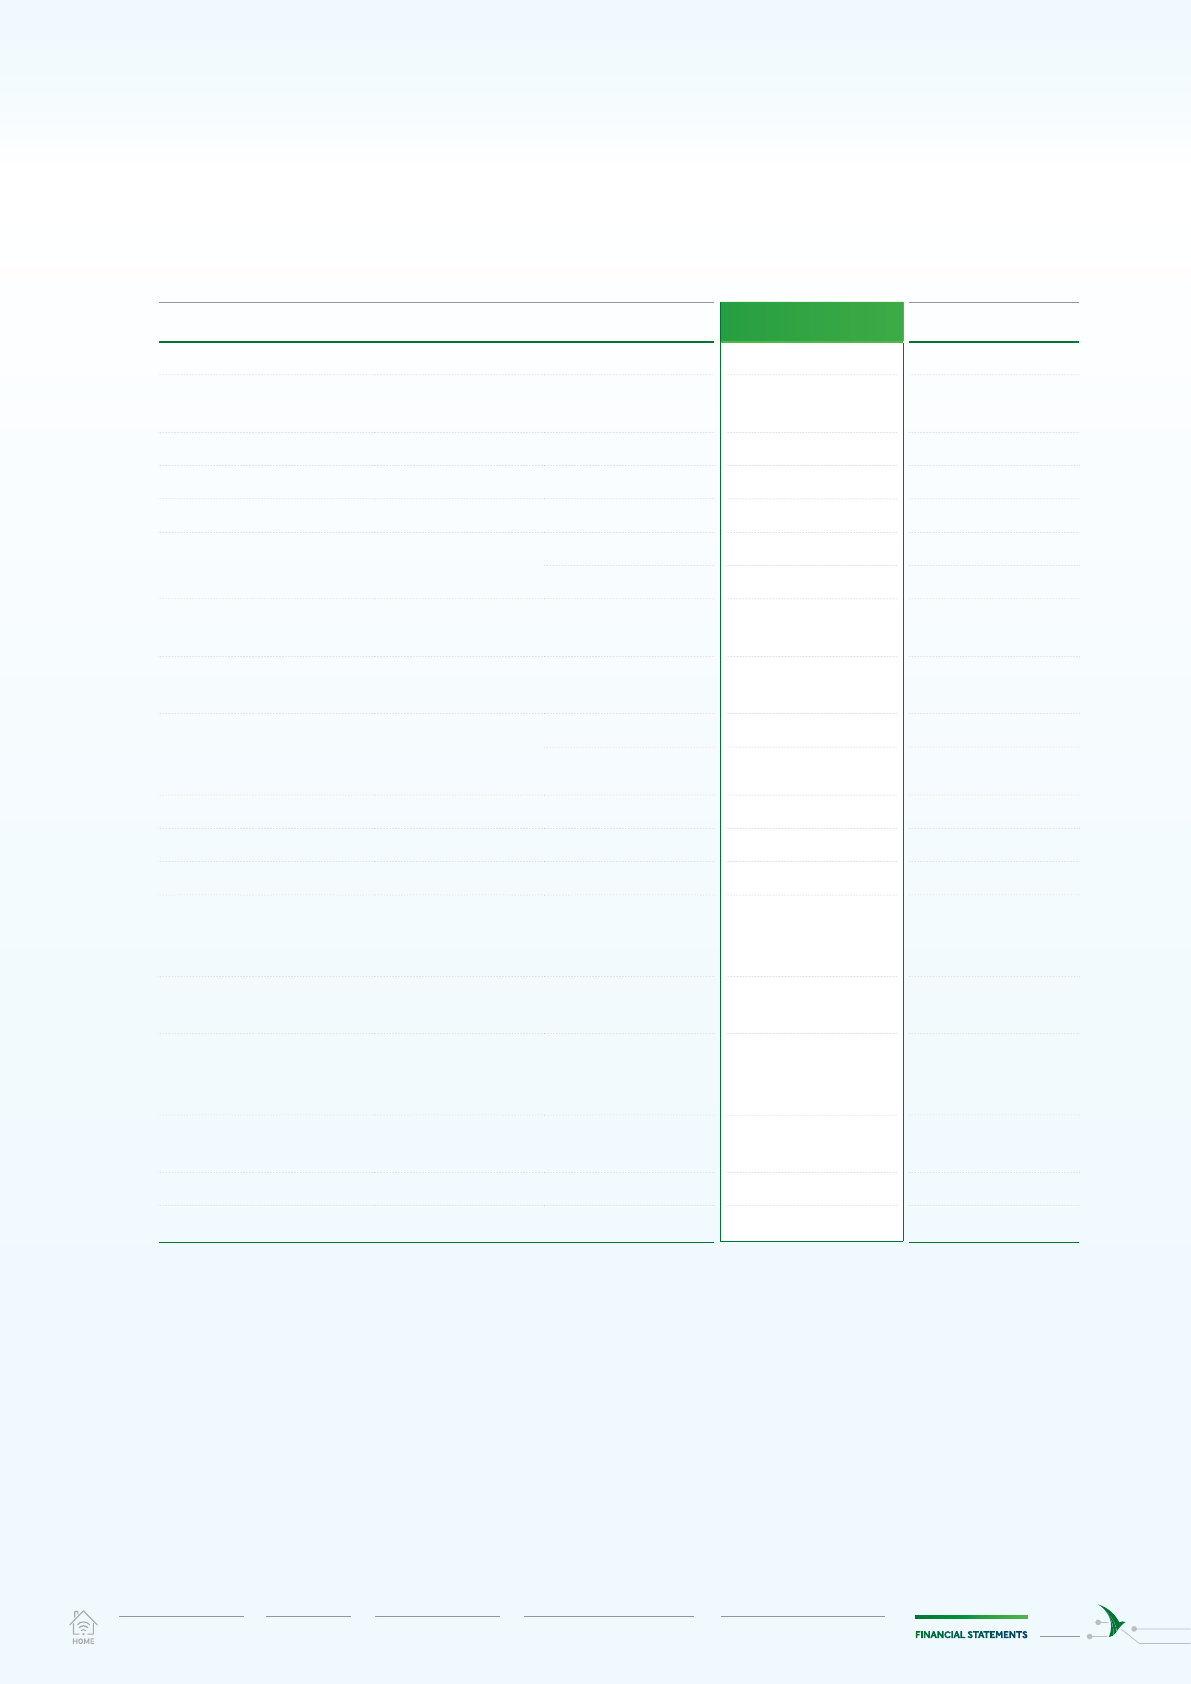
VND
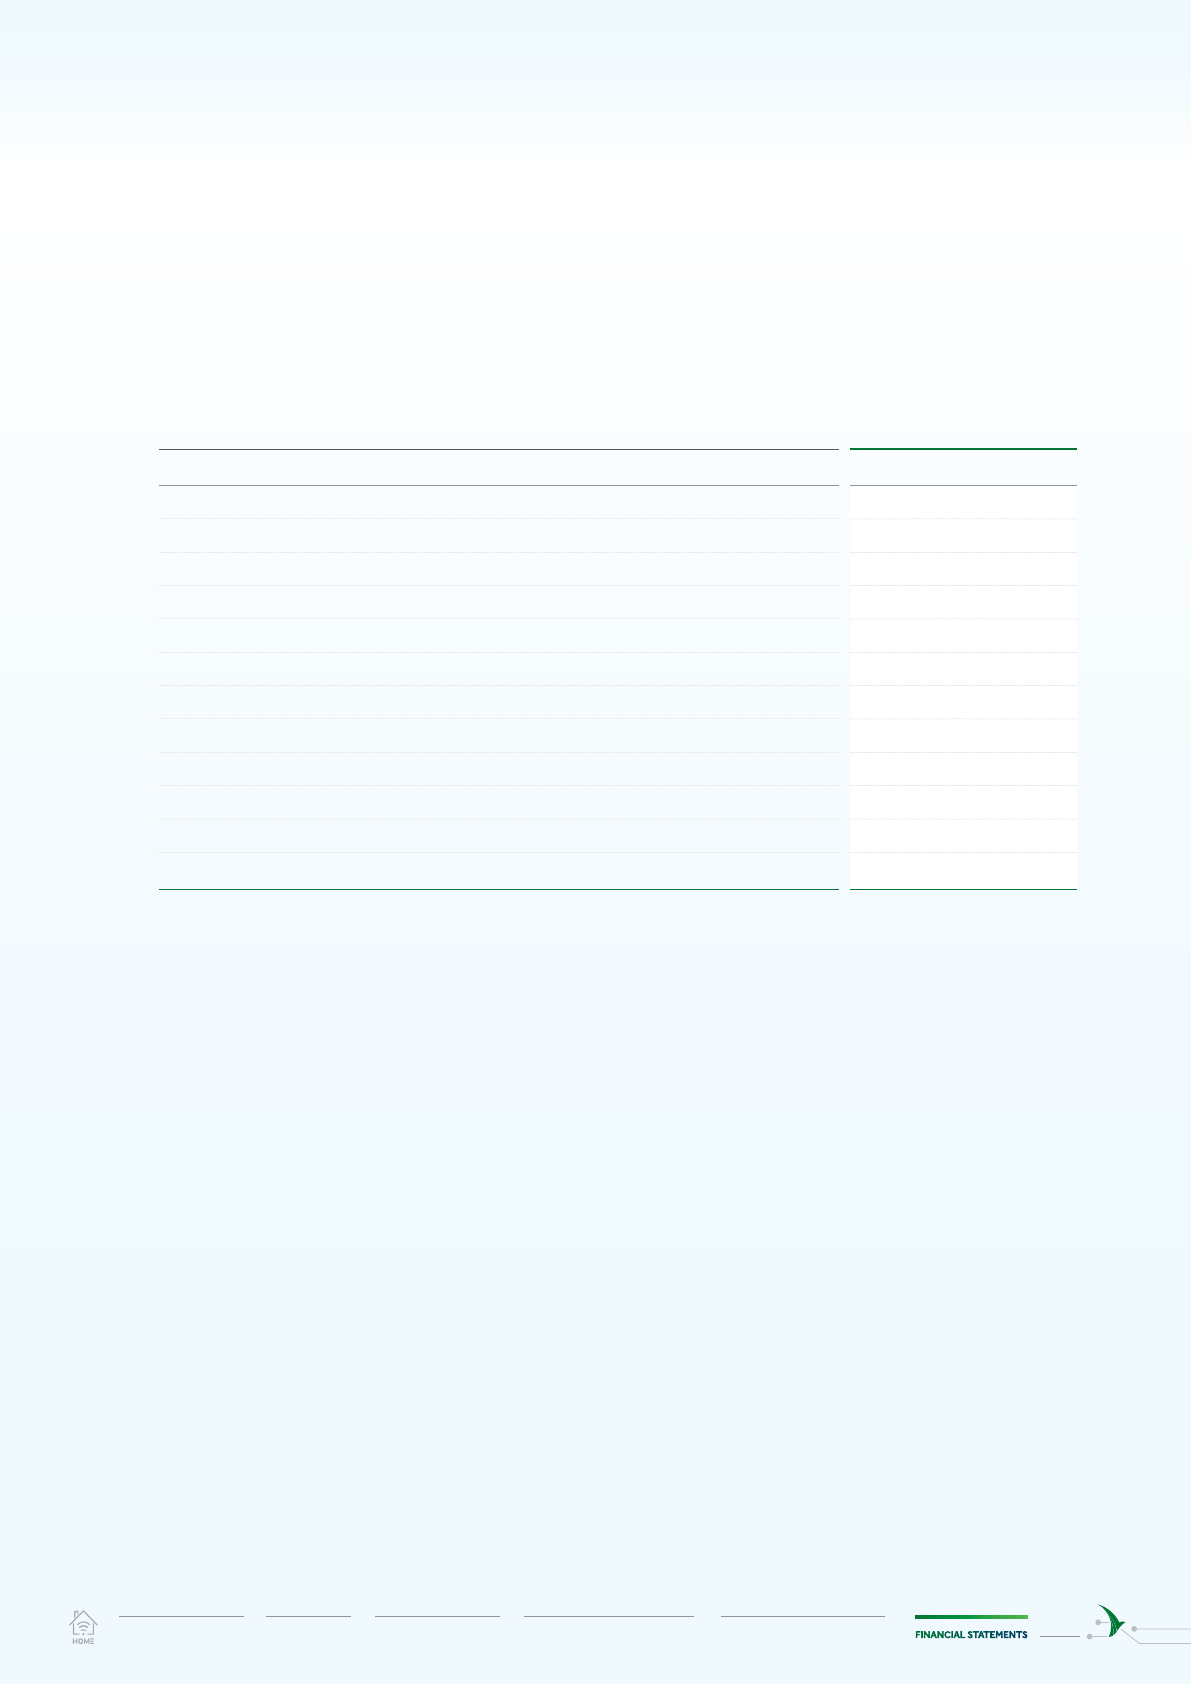
Code ASSETS Notes Ending balance Beginning balance
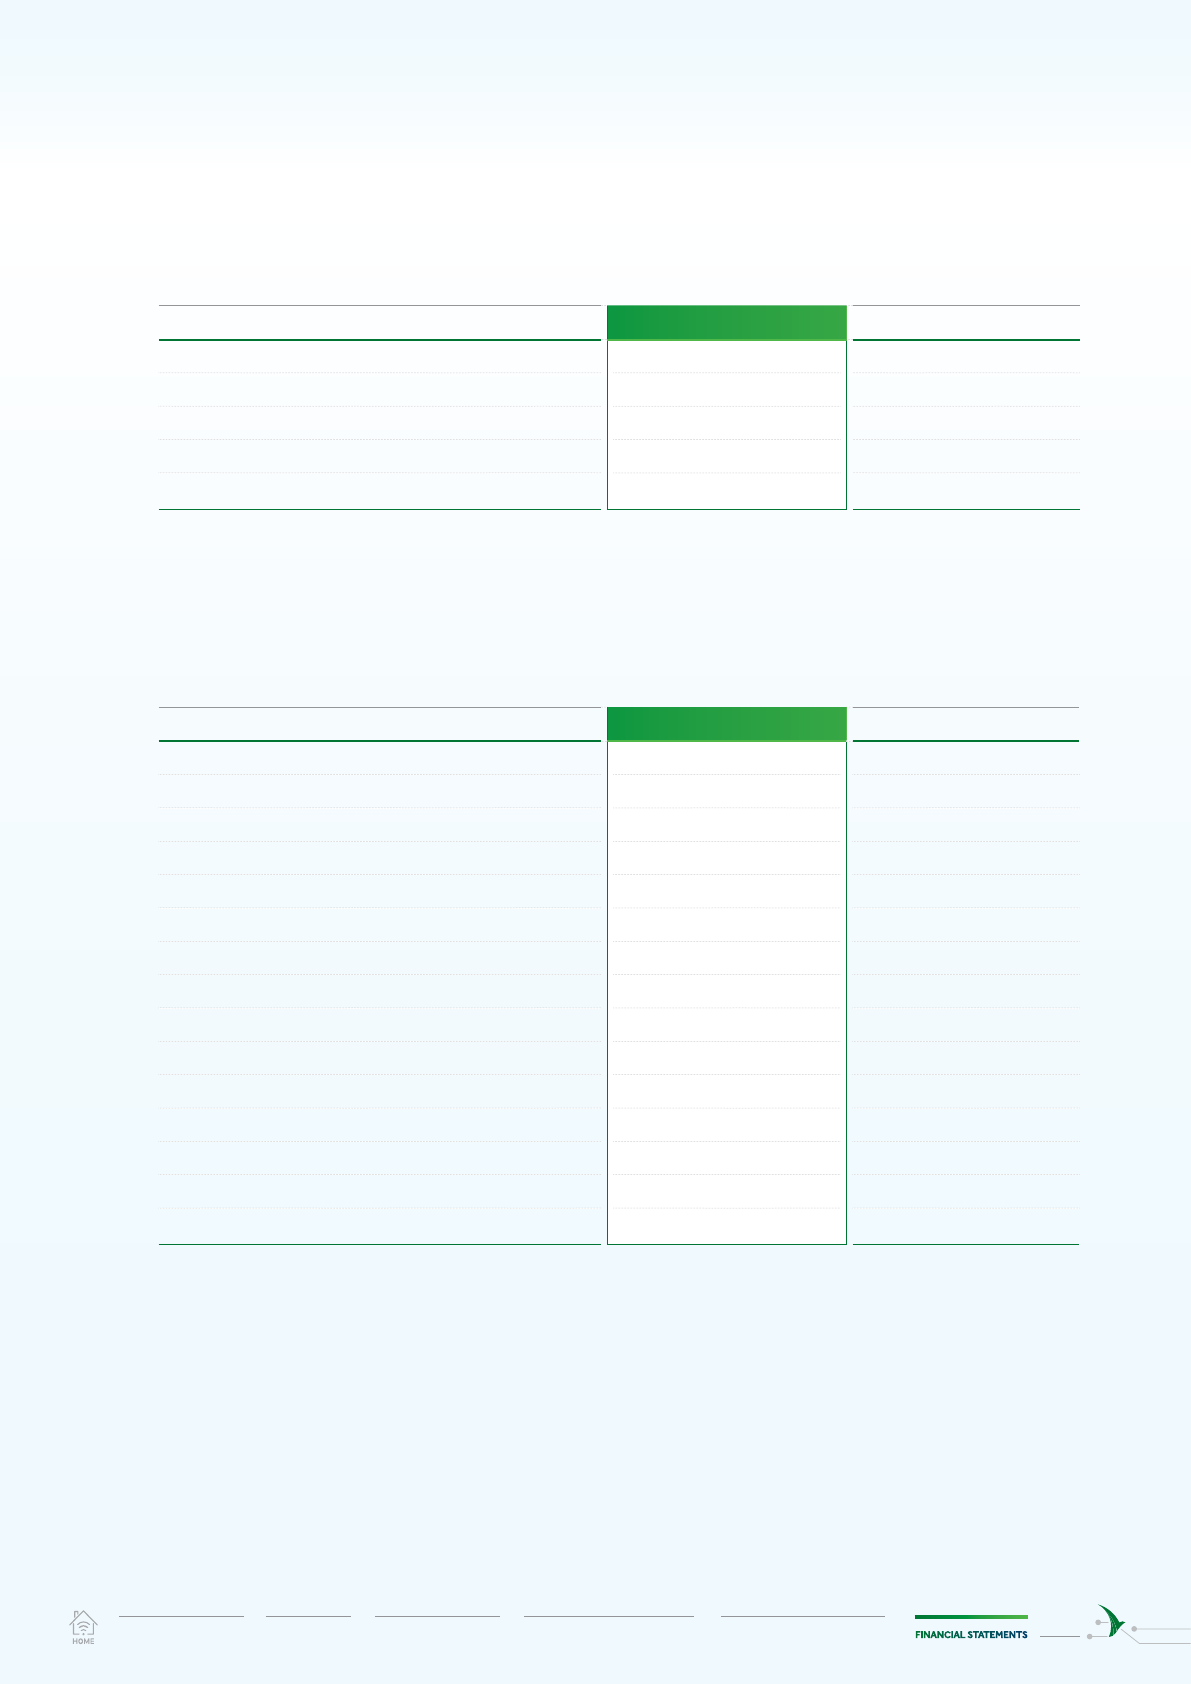
100 A. CURRENT ASSETS 12,577,330,513,959 10,030,796,116,425
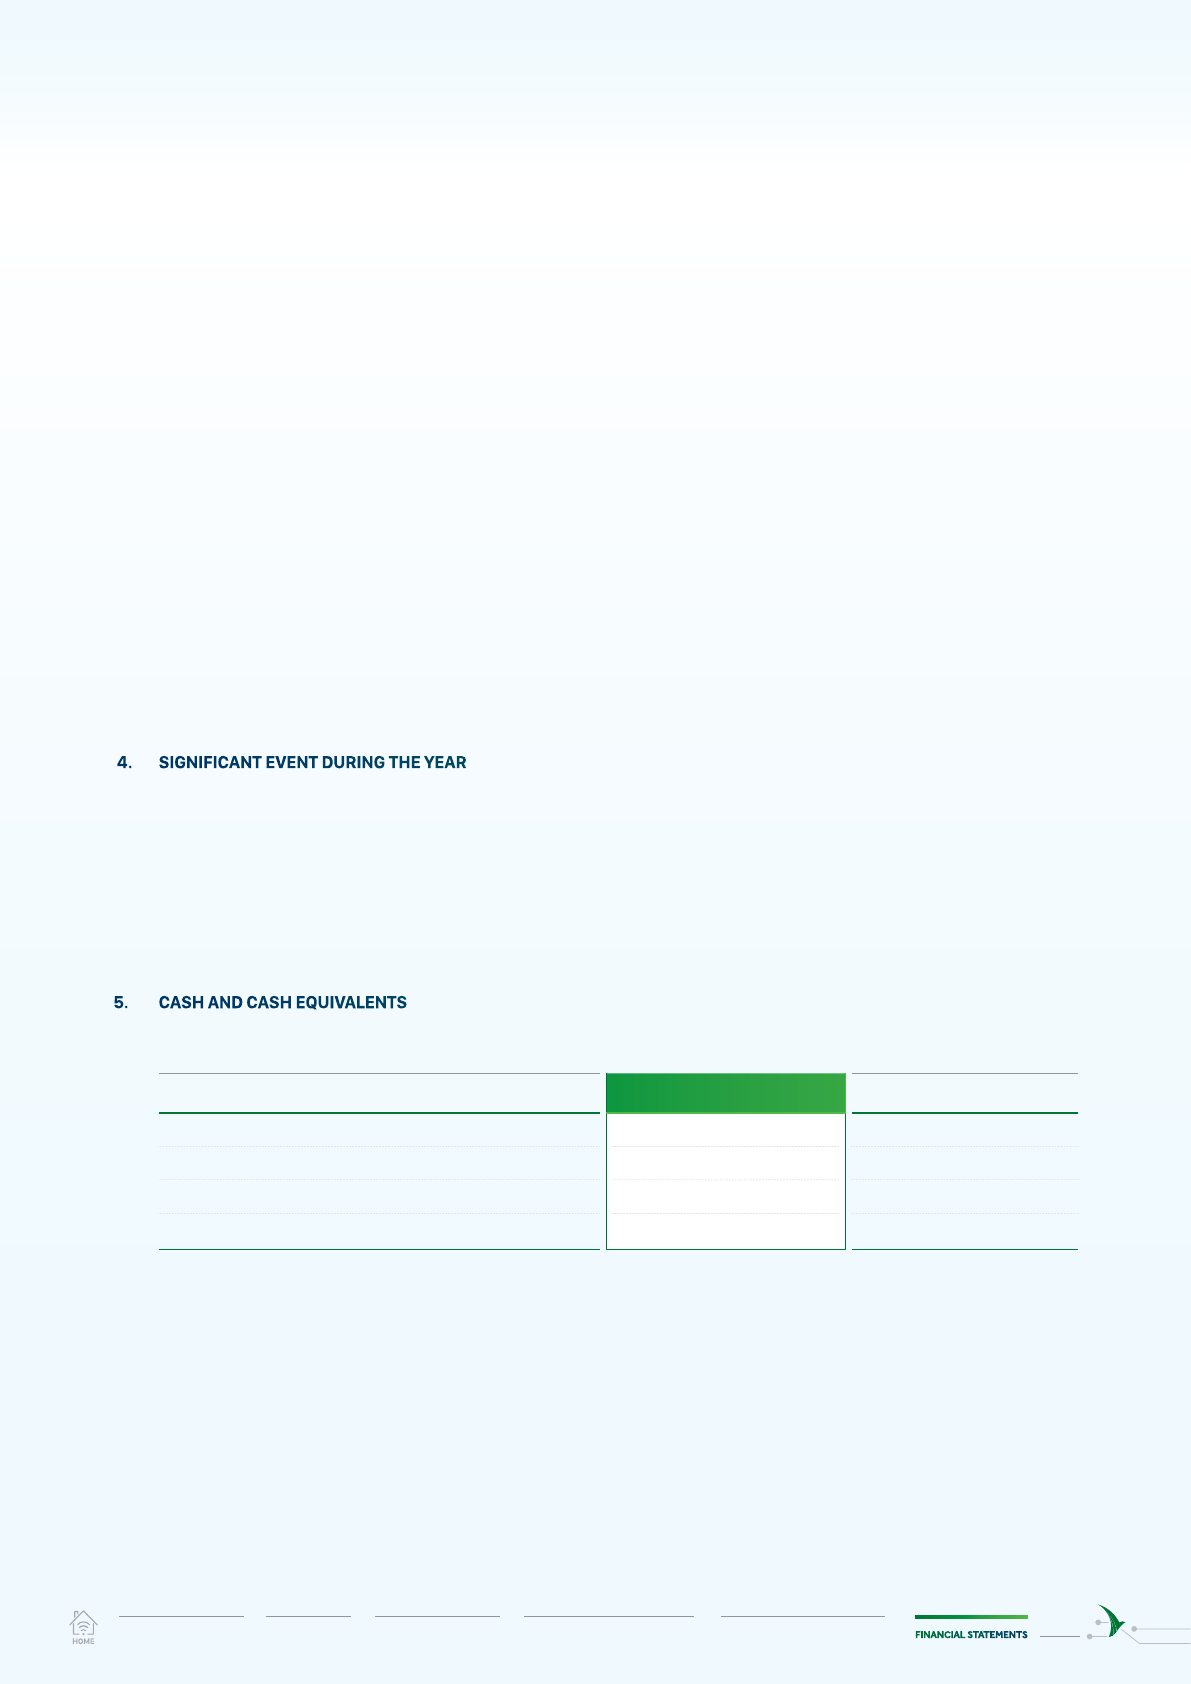
110 I. Cash and cash equivalents 5 1,823,297,113,682 999,620,661,512
111 1. Cash 1,008,162,514,798 799,320,661,512
112 2. Cash equivalents 815,134,598,884 200,300,000,000
120 II. Short-term investments 1,239,955,689,130 899,284,845,919
121 1. Held-for-trading securities 6 671,893,844,171 403,156,950,516
122 2. Provision for held-for-trading securities 6 (67,055,613,671) (43,067,104,597)
123 3. Held-to-maturity investments 7 635,117,458,630 539,195,000,000
130 III. Current accounts receivable 6,219,459,439,416 5,447,159,078,206
131 1. Short-term trade receivables 8 1,439,713,356,060 1,026,526,902,684
132 2. Short-term advances to suppliers 9 3,018,336,296,112 2,522,123,757,499
135 3. Short-term loan receivables 272,662,918 673,291,034
136 4. Other short-term receivables 10 1,811,707,695,287 1,937,434,918,704
137 5. Provision for doubtful short-term receivables 8, 9, 10 (50,570,570,961) (39,599,791,715)
140 IV. Inventories 11 3,158,779,109,857 2,529,346,657,059
141 1. Inventories 3,176,587,967,128 2,541,154,800,749
149 2. Provision for obsolete inventories (17,808,857,271) (11,808,143,690)
150 V. Other current assets 135,839,161,874 155,384,873,729
151 1. Short-term prepaid expenses 12 25,488,691,285 48,619,538,175
152 2. Value-added tax deductible 22 97,009,072,862 92,081,678,271
153 3. Tax and other receivables from the State 22 13,341,397,727 14,683,657,283
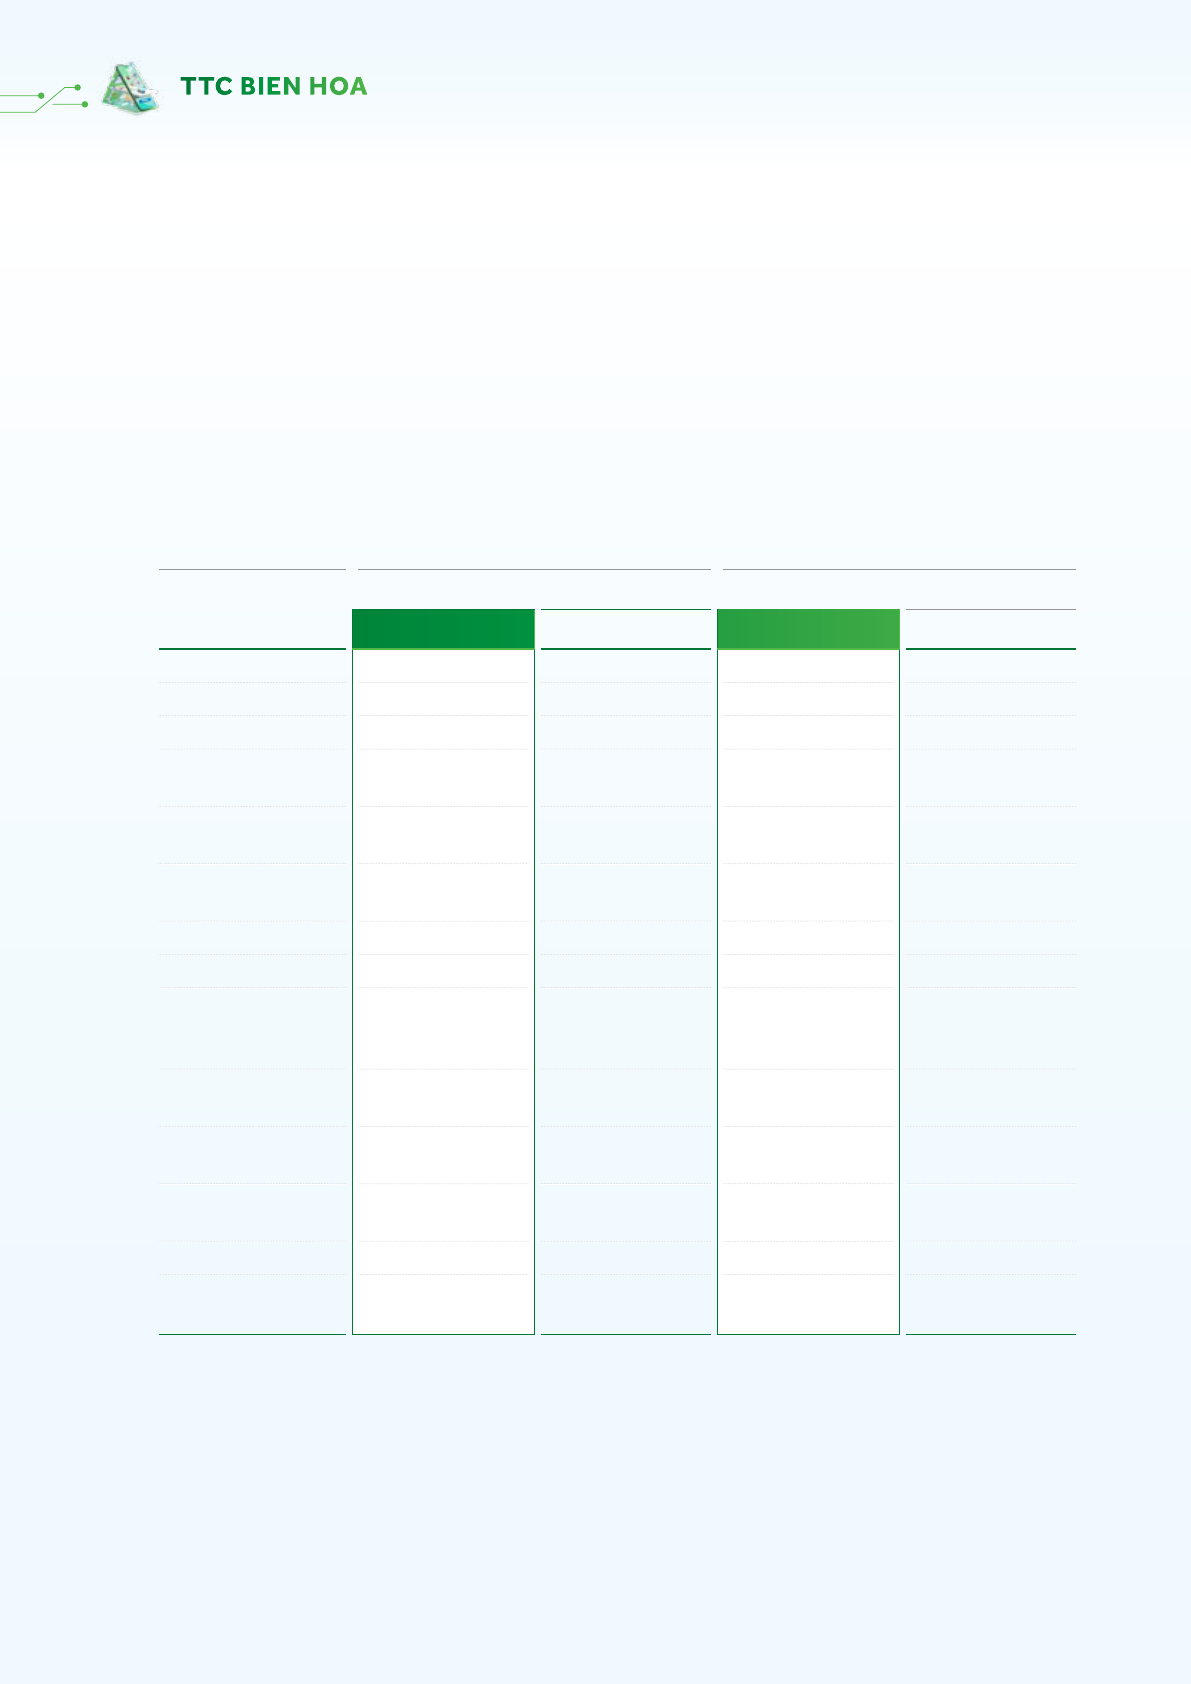
200 B. NON-CURRENT ASSETS 7,893,568,735,300 7,924,922,667,487
210 I. Long-term receivables 134,910,654,507 101,806,889,451
212 1. Long-term advances to suppliers 9 97,009,546,692 92,623,661,450
215 2. Long-term loan receivables 3,085,633,364 -
216 3. Other long-term receivables 10 77,766,758,024 9,183,228,001
219 4. Provision for doubtful long-term receivables 9 (42,951,283,573) -
220 II. Fixed assets 3,922,472,696,557 4,179,804,562,879
221 1. Tangible xed assets 13 3,495,944,778,665 3,844,903,217,562
222 Cost 8,315,932,564,826 8,484,840,315,880
223 Accumulated depreciation (4,819,987,786,161) (4,639,937,098,318)
224 2. Finance leases 14 96,193,621,914 108,160,541,664
225 Cost 114,851,907,684 140,481,291,500
226 Accumulated depreciation (18,658,285,770) (32,320,749,836)
227 3. Intangible xed assets 15 330,334,295,978 226,740,803,653
228 Cost 407,760,556,202 284,497,398,107
229 Accumulated amortisation (77,426,260,224) (57,756,594,454)
230 III. Investment properties 16 577,878,136,995 592,437,897,729
231 1. Cost 633,621,394,024 638,075,095,511
232 2. Accumulated depreciation (55,743,257,029) (45,637,197,782)
240 IV. Long-term asset in progress 404,248,687,906 341,526,808,768
242 1. 1. Construction in progress 17 404,248,687,906 341,526,808,768
250 V. Long-term investments 18 1,411,279,203,604 1,245,605,087,900
252 1. Investments in associates 18.1 366,562,215,361 381,424,975,548
253 2. Investments in other entities 18.2 941,013,453,920 767,001,478,655
254 3. Provision for long-term investments (6,976,465,677) (2,001,366,303)
255 4. Held-to-maturity investments 18 110,680,000,000 99,180,000,000
260 VI. Other long-term assets 1,442,779,355,731 1,463,741,420,760
261 1. Long-term prepaid expenses 12 1,303,267,123,794 1,319,693,751,650
262 2. Deferred tax assets 35.3 26,067,595,226 10,072,275,631
269 3. Goodwill 19 113,444,636,711 133,975,393,479
270 TOTAL ASSETS 20,470,899,249,259 17,955,718,783,912
CONSOLIDATED BALANCE SHEET
as at 30 June 2021
B01-DN/HN
SBT AT GLANCE CORPORATE GOVERNANCE OPERATION THROUGHOUT THE YEAR SUSTAINABLE DEVELOPMENT REPORT FINANCIAL STATEMENTSSBT - IMPRINT OF THE YEAR
267